- Edukasi
- Analisis grafik
- Fibonacci Retracements dan Elliot Waves
Fibonacci Retracements and Elliot Waves
When a tendency is reversing or a new tendency is forming we always wonder how much the price will move. The different methods such as Fibonacci retracements help us to answer this question.
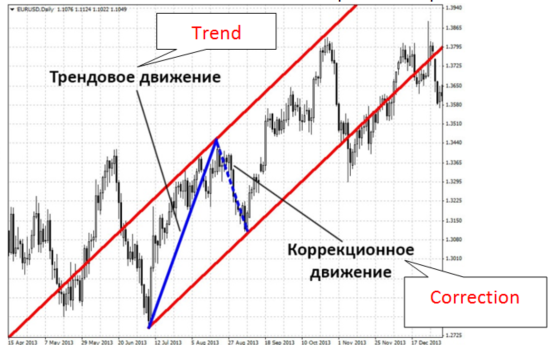
First, let's understand what a retracement is. A retracement (correction) is a movement in the trend channel against its direction. Thanks to the correction, a trend channel is formed. You can see the example in the picture:
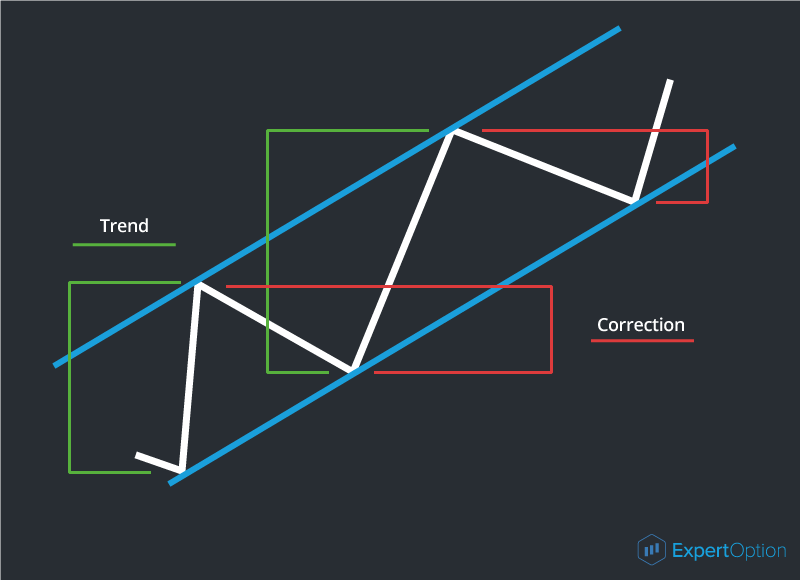
Any movement is followed by the correction. This is a structure of the market: at the beginning of the movement all participants are buying and when prices stop moving they want to fix their profits and start to sell. This is the reason for the correction. The correction strength depends on several participants in the market.
The Fibonacci retracements are the horizontal levels used to suggest the target correction length. Let's take a look at how it works.
Leonardo Fibonacci was a famous Italian philosopher, mathematician, and trader who promoted the use of Arabic numerals in Europe. One of his other achievements was a sequence of numbers later known as Fibonacci numbers. In the Fibonacci sequence, each number is the sum of the previous two numbers: 0, 1, 1, 2, 3, 5, 8, 13, 21, 34, 55, 89, etc. According to a legend, he discovered his sequence of numbers while watching the breeding of rabbits.
This sequence can't help us in the market but its properties give us the useful ratios which we encounter in life and which correspond to the golden ratio rule. Here are some of its useful properties:
1) Dividing one number in the series by the number that follows gives us a ratio of 0.618.
2) Dividing one number in the series by the number that is found two places to the right gives us a ratio of 0.382.
So we have received the Fibonacci coefficients which are used to estimate the correction depth. The sum of these ratios equals 1. They noticed that the correction on the market can be equal to 38.2%, 50%, or 61.8% of the previous movement.
• 38.2% correction can be on the strong trend with a big angle of slope;
• 50% correction usually occurs on the longest normal trend;
• 61.8% correction appears when the trend is volatile and weak.
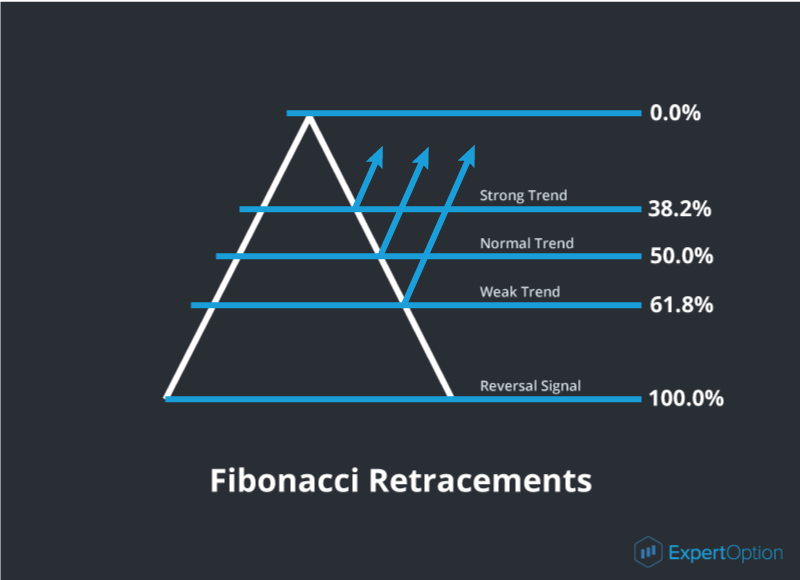
How do the Fibonacci retracements and the correction depth help us in trading? They give us a good chance to open a successful deal: trade online when the price jumps back from the 38.2%, 50%, or 61.8% correction level. If the price chart has broken the 61.8% level and continues to move we have the true tendency reversal signal, which offers new trading opportunities.
The Fibonacci retracements are a trading instrument that is easy to use and install. When you set the levels on the chart you should remember: on the ascending price chart the 0% level will be at its maximum and the 100% level will be at the minimum. And on the descending chart, the 0% level will be at its minimum and the 100% level will be at its maximum. As you understand, we use the maximum and minimum prices to set the Fibonacci retracements.
The first trader who began to use the properties of the Fibonacci sequence was an American financier and trader Ralph Nelson Elliott. Thanks to him, we know the trading instruments based on the Fibonacci sequence of numbers. He's also famous for his "Wave Principle". According to this principle, all price movements are impulses and the corrections appear after each impulse. The impulse is a 5-wave movement with a 3-wave correction. You can see the example as follows:
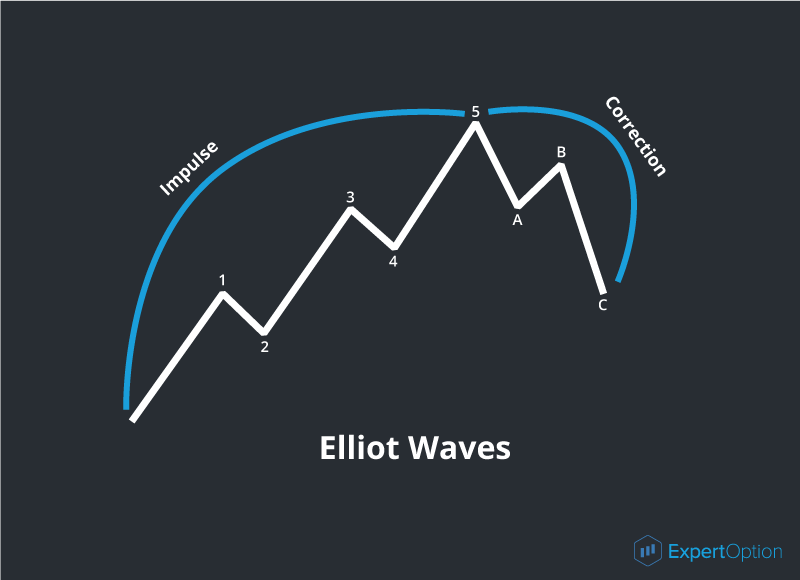
In the picture, we can see that waves 1-5 form the impulse of the uptrend, and waves A, B, and C form the correction. The waves 1, 3, and 5 of the impulse with the same direction are called the impulse waves, and waves 2 and 4 are called the correction waves. The waves A and C of the correction are the impulse waves for this correction. The wave B is a correction wave. You should remember that any wave of the bigger time interval will consist of 5 impulse and 3 correction waves on the smaller time interval. If we know the wave properties of the trend we can foresee its period and buy calls or puts on time.